Solutions
The power of data analytics


We will build a software which will help to steer and visualize the data collected from connected devices. Check our cases to see by yourself.
At Liki, we empower organizations thanks to improving, honing, and innovating information. If you want to tell the stories hidden in your data, we’re ready to deliver an intuitively interactive custom-built dashboard for your company so that you can make better decisions faster.
Data visualization services
In the increasingly data-driven world, having accessible ways to view and understand data is more crucial than ever. Companies deal with data sets that include hundreds of data points and the demand for data skills in employees is skyrocketing. That is where data visualisation tools come in handy. Forget data analytics – innovative businesses are struggling to visualize and map out data and it’s our job to make it significantly easier for you

Great examples of successful implementation of data analysis practices and experience are the customer care app for telecom and the Orange Live Objects platform. These systems are different, but both play the role of storing and classifying different types of data. The data preparation and data analysis techniques implemented in the customer care app help to make business decisions and to prepare personalized offers for clients of Liki’s telecommunication partner. The system created by Liki also helps to analyze errors in real-time.
An IoT platform for objects and data enables managing the range of objects, collection, and storing the data securely. The platform supports integration with AWS, Azure, and Google Cloud. Development of a mobile app dedicated to the Orange Live Objects services.
As a result, the flexible and scalable tool allows businesses for the devices, messages, and data management. the open solution is compatible with all market standards now.
The importance of data processes
01
Data management
02
Data analytics
03
Data visualization
Data has quickly become one of the most valuable assets an organization possesses. Information about customers, processes, and employees, which, handled properly, is an important part of a successful strategy, whether it be an operational, marketing, financial, or educational one. Handling business data within the organization usually includes three areas:
Data management
It mostly focuses on the acquisition and preparation of data for other purposes in the organization. It includes building databases, uploading data to data stores, creating backups, or granting access to certain data files to various stakeholders. It’s overall control of the company’s data acquisition, storage, governance, and integrity.
Data analytics
Simply speaking, it’s about what value can we derive from the data. Data analytics processes mainly include counting tasks like generating summary counts of events or building reports with summary descriptive statistics. Data analytics also refers to applying statistical modeling tools to predict future events based on historical data. As opposed to data management, data analytics conceives, develops, implements, and practices all technical applications of the data assets.
Data visualization
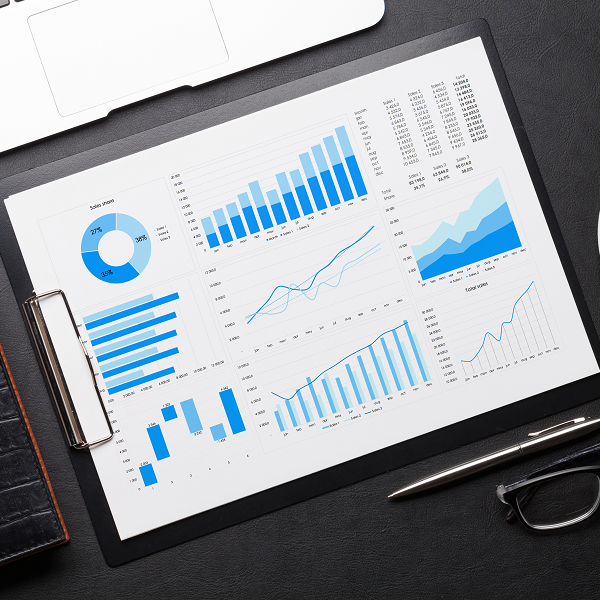
It’s the process of creating a visual representation of a data set’s trends, patterns, and critical insights. Some of the most popular visualizations include pie charts, tables, timelines, Gantt charts, scatter plots, and bar charts. Data visualization processes need a software called data visualization tools to create visualizations.
In the last few years, especially the importance of data visualization has been growing. Data visualization can help you discover Business Intelligence insights or convey complicated results to other stakeholders. Also, it helps you analyze and understand hidden trends in your business data – of course, some trends are obvious, but many datasets are too large to interpret without visualizations.
What are data visualization tools?
Data visualization uses visual elements like charts and graphs to represent information or data in a graphical way. In today’s world, data technologies are essential to analyze massive amounts of information and making data-driven decisions. Data visualization tools provide us with an easier way to create visual representations of large data sets. Such visualizations can be then used for different purposes such as dashboards, sales and marketing materials, annual reports, or investor slide decks.
Data visualization tools are software applications that render information in a visual format. They make it much easier to understand and work with large amounts of information. While properly configured, data visualization tools sift through massive datasets to present only the most relevant data.
Data visualization tools vary. It can be a simple software that emphasizes simplicity or a complex platform that requires a high degree of technical skill. The most common types of visualizations are charts, graphs, tablets, geospatial, infographics, and dashboards or google charts. The data visualization tools we implement for our clients are easy and intuitive to use and at the same time, they can handle huge sets of data. The custom solutions we offer can even handle multiple sets of data in a single visualization. They can output both images and interactive graphs or, if necessary, they focus on a specific type of chart or map. At Liki, we also know that a higher price tag doesn’t necessarily mean a more comprehensive solution. We deliver custom, fully tailored tools so that your requirements and needs are fully met.

Are you ready to take the next step with Liki?
Bring the power of data analytics to your business.
Why do you need data visualization tools?
The importance of data visualization tools is simple – they allow you to see, interact with, and better understand data. It helps everyone to be on the same page, regardless of their level of expertise. This is what you can expect when you use data visualization delivered by Liki:
Graphical presentation of patterns and trends is easy as 1, 2, 3. Data visualization tools enable effortless trend analysis. You can quickly analyze current and historical events and predict future ones. You can also use different types of interactive visualizations to perform trend analysis.
You can share information easily with all parties. Everyone throughout the organization can access the data.
You process data faster. Visual content is processed much faster than text. In a world where everyone is overloaded with information, it is easier and more effective for us to process and section out necessary information with visuals. Data visualization tools help make it possible to effectively comprehend the information presented.
You make better business decisions. A quick analysis of complex datasets in your dashboards is intuitive and simple, which helps you find key insights instantly. The process of representing complex data in an easily understandable format is simplified. This enhances collaboration and communication in the decision-making approach.
Identification of the correlation between operations and results takes less time. Correlation helps you discover the relationships among independent variables through data visualizations. Finding such correlations is crucial to stay ahead of the competition and tracking connections between operations and overall business performance.
While visualizing data, you receive actionable items. You can see where there’s room for improvement or where performance is high. Actionable items enable you to identify successes and areas for improvement.
Your business is more productive and sales – boosted. You save time creating manual up-to-date reports which increases efficiency. Finding the right information is simpler which saves the time of your IT team. More people can focus on driving sales and growth with data visualization capabilities.
How can Liki help you with data visualization?
To ensure that you don’t miss out on opportunities derived from data processing, we have developed innovative solutions based on reliable data visualization tools. The tools we use help businesses in interpreting big data into standardized and structured reports in the form of visually appealing and highly interactive dashboards. The way the data is visualized clearly reflects your requirements and needs. Our data visualization services include (but are not limited) to:
Business Intelligence software selection – we’ll make sure you have the right tools to process and navigate your data.
Data visualization processes – we design intuitive dashboards and interactive reporting that allow you to understand your data in new ways. Our platform-based visualization solutions are simple, and affordable, and they have a quick impact.
Business Intelligence implementation – we have deployed numerous enterprise-wide data analytics solutions and optimized existing implementations. We’ll help you deploy the system of your data visualization tool and customize it, automate reports, and perform technical upgrades.
Consulting and training services – we’ll share data visualization knowledge and best practices with you and your team.
Why choose Liki
Looking for a company that will help you identify the visualization solution for your individual needs? You’ve come to the right place! Our tools will transform your data into an interactive and customized dashboard of Business Intelligence. Start collaborating with us and:
Bridge the gap between your company data and the stories it says.
Automate data processing and reports, reducing dependency on manual data feeding work.
Get the most innovative data modeling and mapping methods to collect insights across platforms.
Access profound expertise based on industry knowledge and several years of experience.
Get a customized solution fully tailored to your needs.
Be supported by the best customer service on the web.
Our workflow
Collecting
We collect all the necessary information about your requirements and needs. We need to make sure we are gathering and consolidating the correct data.
Data cleaning
We cleanse the data before it is modeled. When it comes to data visualization, nothing is worse than using the wrong data. We ensure the highest quality and accuracy before proceeding ahead with data visualization.
Mapping and modeling
We apply innovative data mapping and modeling techniques based on your needs. We choose charts and graphs depending on the insights you want to highlight.
Data visualization
The last step is data visualization. We implement the solutions we developed during the previous steps and represent the required data in the right visual formats with insights.
This is how we build data-driven cultures where all stakeholders have access to vital insights to make better decisions.
Visualize data with Liki
Proper data visualization is a way to bring the power of data analytics to your business. From marketing to finance, data visualization tools make massive amounts of data understandable and actionable across various lines of business. At Liki, we fully believe in the great potential of making data more meaningful to people through organizations. We provide our clients with immersive dashboards that make a huge difference in the way data visualization software impacts their companies. We enable increased visibility and leverage hidden patterns within businesses and their data to make impactful data-driven decisions.

Jan
CEO

Kasia
Digital Value Manager

Piotr
Business Representative

